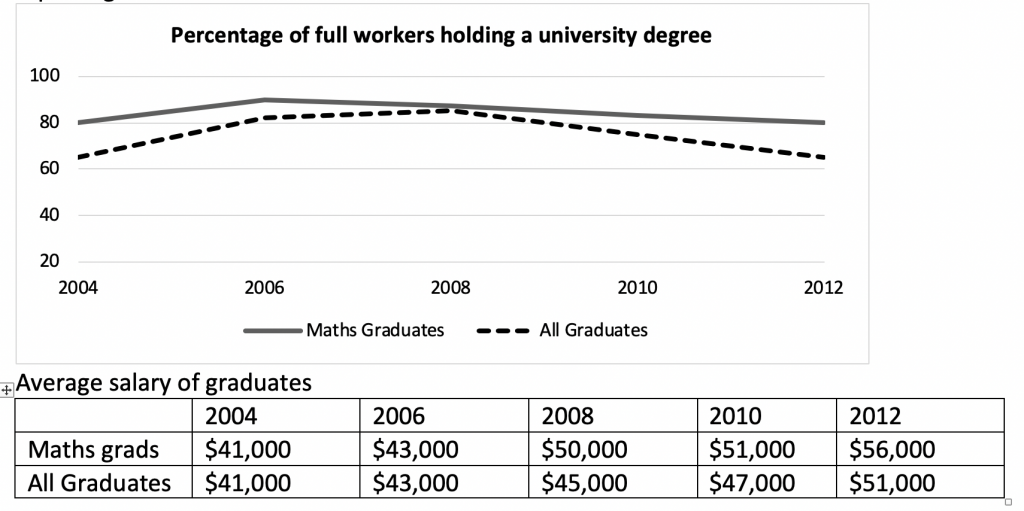
The graphs below show the percentage of math graduates and all graduates who got full time job after graduating from a university in Australia and also show the average salary of both these types of grads, from 2004 to 2012. Summarise the information by selecting and reporting the main features and make comparisons where relevant.

The given line and table graph compare the full time employment and average yearly salary statistics for maths and all university Australian graduates from 2004 to 2012.
Overall, it can be seen that maths graduates outdid graduates in general both for average salary and full time employment. Also, while the proportion securing full time employment remained relatively stable, the salaries rose with time for both maths and all graduates.
In detail, in 2004, about 60% of all graduates got full time employment, whereas about 80% of maths graduates secured a full time job. Both the figures increased slightly by approximately 10% in the next two three years. However, after that the proportion fell for both and in 2012, figures stood at nearly the same value as in 2004.
Coming to the average yearly salary, in 2004 the average yearly salary for all graduates was about $41,000 and the figure was the same for maths graduates as well. In the next 8 years, the salaries went up for both, but the salaries rose more for maths graduates as compared to the figures for general salaries for all graduates. Finally, in 2012, maths graduates secured a yearly pay of $56000, whereas graduates, in general, got about $51000.
Written by: indroop Singh


In many countries , traditional dress and costumes are considered effective way of maintaining links with the past.
How effective can traditional costumes be in this sense ?
What other ways exist to help citizens connect with a country’s past ?
Writing