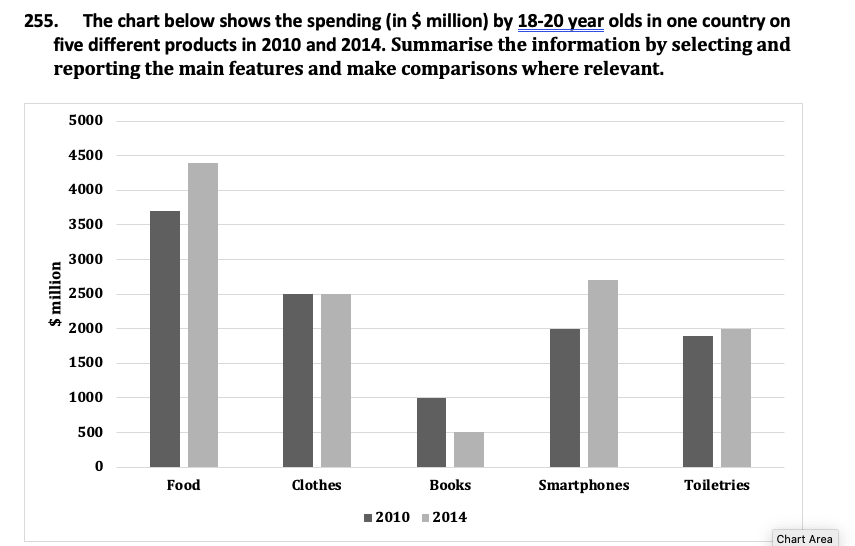
The bar graph compares the spending of 18-20 year olds on food, clothes, books, smartphones and toiletries in 2010 and 2014 in a particular country.
Overall, it can be seen that the spending on all the products except books and clothes rose with time. Furthermore, the maximum spending was done on food in both the years.
In 2010, the 18-20 year olds spent roughly 3700$ million on food, which was followed by clothes at about 2500$ million dollars. Smartphones and toiletries accounted for about 2000$ million in spending each. The least expenditure was done on books, with a figure of only 1000$ million.
In the next four years, the expenditure on food, smartphones and toiletries increased and in 2010, about 4300$ million were spent on food, whereas about 2700$ million were spent on smartphones. The amount spent on toiletries rose minimally by about 100$ million. By contrast, the spending on books became nearly half. Lastly, the expense on clothes remained unchanged at 2500$.
The given bar chart illustrates the information about how much money was spend on five different products by adults (18-20) in two different years.The figure was in $million. It is clearly visible from the bar chart that in 2010,nearly $3500 money was spent on food and it steadily increased to $4500in 2014.followed by smartphone, around 2000$ was expended and it showed $3000rise in 2014.In case of cloths,it remained the same in both years.Money spending on tolletries swelled from $2000 to $2500 in the given year.Students showed least preference to buy books. It was 1000$ in 2010 .however,it declined to$500 in the end year. Overall,it can be seen from the chart,the majority of youngsters was expending money on food as compared to any other products.
The given bar graph compares the amount of money suspend by adults (18-20 years old) on food, clothes, books, smart phone and toiletries in 2010 and 2014 in one of the country of the world.
At the onset, it is clear that in context to all other products, the highest amount of money is spended on food. However, there is no significant difference noticed on clothes and toiletries with the passage of four years.
In 2010, the highest expenditure by the adults on food was roughly above 3500 million dollars whereas the least expense observed was 1000 million dollars on the books. In addition that, $2500 million were spended on clothes and 2000 million dollars were used to buy smart phones and toiletries. Moreover, books, are the product on which the least amount of money is incurred and was 100 million dollars.
Even after the four years, in 2014, food product ruled the market with a record of about $4500 million in the country. Additionally, more than half of the money expanded on smartphones in 2014. Vice a versa, the expenditure on book declined by 50%on books. The18 year’s old adult spended almost the same amount of money on clothes and toiletries.
Payal, there are a lot of mistakes in the Graph. Grammatical as well as usage of connectors.
There are a lot of spelling mistakes too – spended- spent, Expanded- expended.
You are trying too hard to focus on vocabulary.
And your graph is very confusing, you are jumping from one country to another without any connection between the two.
If I had to rate it , it would range between 5-5.5.
And sorry again for the delay.
Can you give me knowledge about reading of 12th December 2019
Sorry, I dont think any of the readings on that day were from our book.
It is really helpful