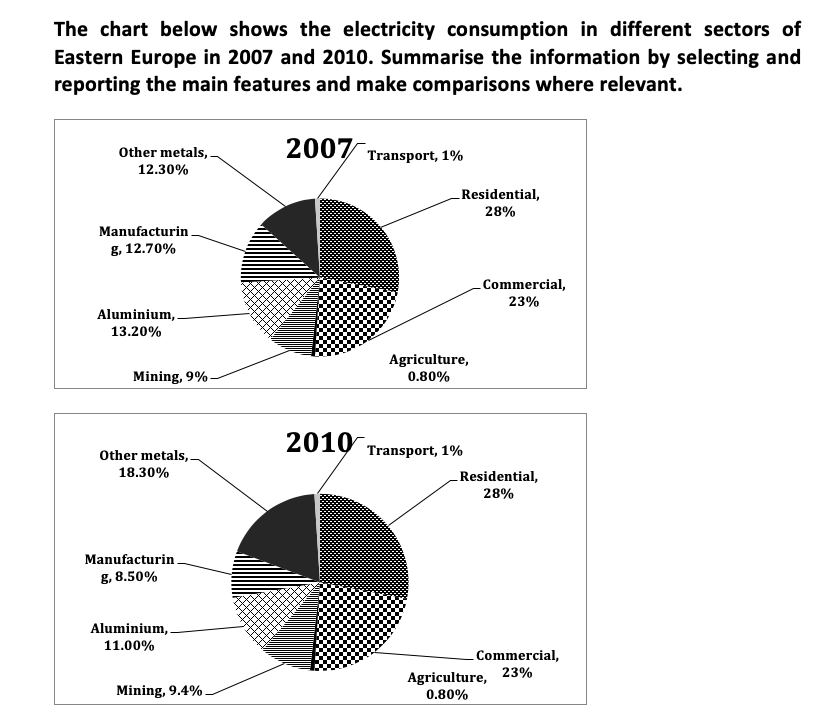
The pie charts compare the consumption of electricity in different fields in Eastern Europe in 2007 and 2010.
Overall, it is evident that most electricity consumption can be attributed to two sectors, domestic and commercial. Also, the share of electricity consumption saw a major change mainly in the production of aluminum, other metals and manufacturing, while in other sectors the share remained almost stable.
Looking at the graph in more detail, the residential sector contributed to the maximum electricity usage, with figures of 28% in both years. In the commercial sector, slightly less than a quarter of the electricity was consumed. Here again, the share of consumption remained constant. The percentage of electricity consumed in transport and agriculture was only about 1% each in both the years.
The share of electricity consumption in the production of aluminum and other metals was around 13% in 2007. While the consumption increased in other metals to 18%, it fell in aluminum to around 11%. Like aluminum, the figures for manufacturing also fell, from 12.7% to 8.5%. Finally, mining attributed for 9% of electricity use in 2007 and there was a very slight rise in its share to 9.4% by 2010.