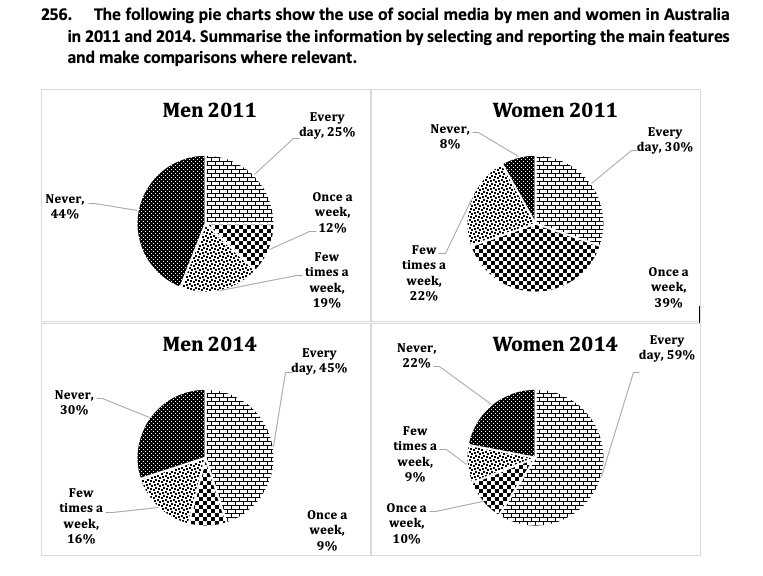
The pie charts illustrate the information about the frequency with which males and females used social media in 2011 and 2014.
Overall, it can be seen that a higher proportion of women used social media than men. Also, the maximum increase was in the everyday users’ proportion in both the years.
In 2011, everyday social media users accounted for 25% of the men, while this figure stood at 30% in women. In the next four years, the proportions for both genders increased considerably to 45% in case of men and 59% in case of women. By contrast, the few times a week, users fell among both the genders. In 2011, about a fifth of both the genders used social media, while in 2014, this figure stood at 16% for males and 9% for females.
There was not much change in once a week, users in males and their proportion was 10% in both the years. However, this proportion fell considerably from 39% in 2011 to 10% in 2014 for females. The proportion of men who never used the social media fell from 45% in 2011 to 30% in 2014, but in the case of women, surprisingly, it increased from 8% to 22% between the two years.
Written by: Indroop Singh
sir, can you please tell how much bands can i get from the above answer which i have given.
The pie chart illustrate the utilisation of social media by male and female users in their daily life between 2011 and 2014.
In the year 2011, every day users of the social media was 25 per cent in male and 30 per cent in female.However,It has increased in the year 2014,and reached to 45 per cent in male and 59 percent in female.While,the men and women who never used the social media was 44 per cent and 8 per cent,But in the year 2014, never used male has decreased to 30 per cent and had the opposite change in female which has increased by 22 per cent.
In addition,the change in the few times a week users in men and female has small change in the usage compared to 2011 and 2014.The male and female who used the media once a week in 2011 was considerably,stood at 12 per cent and 39 per cent,But in case of male it has a slight change in 2014 with 9 percent.And in case of females it has fall and reached from 39 per cent to 10 per cent.
In conclusion,we can see that the highest user of social media are women compared to men.And everyday user has a maximum rise in both male and female users.
Kavi there are too many small mistakes.It will not exceed 5.5-6. Make improvements.