
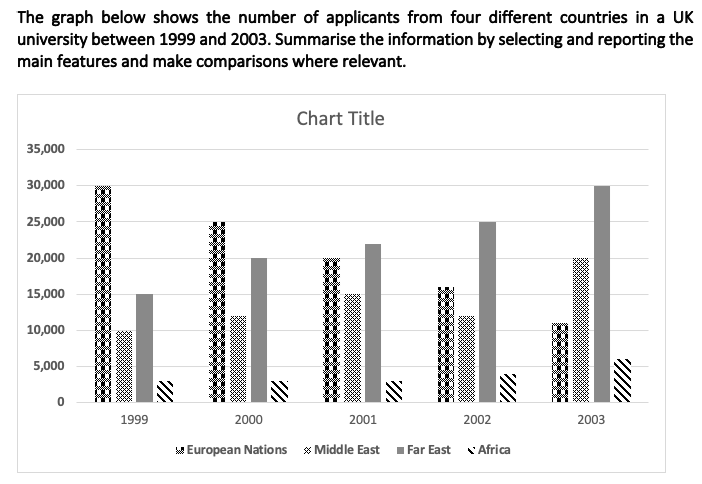
The bar graph illustrates the number of students who applied to a UK university from European nations, the Middle East, the Far East and Africa from 1999 to 2003.
Overall, it is clear that at the start of the period, applicants from European nations were the highest, whereas by the end of the period, applicants from the Far East were the maximum. Moreover, there was no considerable change in the total number of applicants (from all the regions together) to the university.
In 1999, the number of applicants from European nations stood at 30,000. It was followed by the Far East and the Middle East with figures of 15000 and 10000 respectively and only about 3000 Africans applied for the university. Over the next five years, the number of applicants from the Far East and the Middle East nearly doubled reaching figures of 20.000 and 30,000 respectively.
The number of African applicants remained nearly stable at 3000 till 2001. However, after 2001, there was a slight increase and in 2003, the number of African applicants was 6000. On the other hand, there was a substantial decrease in the number of applicants from European nations and their number stood at about 11,000 in 2003.
The assigned bar graph demonstrate the statistics of individuals who applied in uk University from different nations including Far East, Middle East, Africa and European Nations from the year 1999 to 2007.
As an overall trend, it is apparent that, the maximum applicants were experienced in European nations during 1999. However, the least percentage had witnessed in Africa every year from 1999 to 2003 as compared to its counter parts.
On observing the graph in detail, it is evident that, in European nations the perportion of applicants were reached on the peak by 30,000 in 1999, it was followed by Middle East and Far East the percentage was approximately 10,000 and 15,000 respectively. Moreover, in the case of africa the applicants were experienced near about 4000 to 6000 from the year 1999 to2003. Subsequently, applicants had fallen down in the end of year 2003.
Moving to further details, in 1999 to 2003, the figure for Middle East, perportion of applicants was sky rocked to 30,000 in the given period of time. In addition, applicant from Middle east was seemed some fluctuations. however, in the end it was show upward trend. which accounted 20,000.
In 1999,the number of applicants from from Europian nation, where 30,000. Followed by that of Far East which is 15,000, middle East,10,000 and Africa considerably less than 5000. Over, the 5 yes,the number of applicants in Europian Nations was decreasing, while that of Far East
was at increase
The number of students that applied to a UK university from Africa was nearly stable for the 5 yes,when that of middle East increased from 1999 at 10,000 to 2001 at 15,000 and reduced in 2002 at above 10,000 and finally increased in 2003 at 20,000.
Please correct.
Judith, there are so many grammatical mistakes in your comment, which part do you want me to correct?
INDROOP MAKKAR can you please evaluate my answer.(I mispasted 2 line in my above comment that’s why i’m posting a new one.)
=================================================
The bar graph depicts the count of students applying from countries in the European nations, the Middle East, the Far East, and Africa to a UK university in 5 years starting from 1999 to 2003.
Overall, it can be seen that there are more applicants from the countries in European Nations and the Far East in the given period. Furthermore, there is an increase in the count of applicants from the countries in the Middle East and the Far East.
In terms of European Nations, it can be seen that there are 30,000 applicants in the year 1999 and this reduced gradually to just above 10,000 in the year 2003. In the first year, the number of applicants that applied from the Middle East is 10,000 and it rose to 15,000 in 2001, before falling to just above 10,000 in 2002. This count then rose to 20,000 in the year 2003.
The number of applicants from the Far East in the year 2003 was double that of in the year 1999, which was only 15,000. The total count of people applying to the Uk university from Arctica was around 3000 in the year 1999 and this stayed the same in the first three years. This count increased from the year 2002 and reached
just above 5,000 in the year 2003.
INDROOP MAKKAR can you please evaluate my answer.
=================================================
Over the next 5 years, the number of applicants from the Far East nearly doubled reaching a figure of 20,000 respectively.
The bar graph depicts the count of students applying from countries in the European nations, the Middle East, the Far East, and Africa to a UK university in 5 years starting from 1999 to 2003.
Overall, it can be seen that there are more applicants from the countries in European Nations and the Far East in the given period. Furthermore, there is an increase in the count of applicants from the countries in the Middle East and the Far East.
In terms of European Nations, it can be seen that there are 30,000 applicants in the year 1999 and this reduced gradually to just above 10,000 in the year 2003. In the first year, the number of applicants that applied from the Middle East is 10,000 and it rose to 15,000 in 2001, before falling to just above 10,000 in 2002. This count then rose to 20,000 in the year 2003.
The number of applicants from the Far East in the year 2003 was double that of in the year 1999, which was only 15,000. The total count of people applying to the Uk university from Arctica was around 3000 in the year 1999 and this stayed the same in the first three years. This count increased from the year 2002 and reached
just above 5,000 in the year 2003.
If there is any course or coaching from day 1 i mean to say that zero to perfect then please suggest me my contact number is 9878888679
I want to suggestions to you… Can I use trend in the bar graph.. if I can not use trend so what I can use.. even that , I have totally confused about task 1 in bar graph and tabular chart.
Trend means a pattern over a time period, so if there is a time element – ‘I mean years’ in the graph, you can use the word trend. Another word you can use is feature. Whats your confusion, let me know.
The given bar chart provide the information of student applied to the UK universityfrom European nations, the Middle
east, the far east and Africa from 1999 to 2003
Overall, it is clear that at the start of the period applicant from the European Nations were the highest but at the end of the
period applicant from the Far east were taken place, moreover application from the Africa remain lowest through out the period
of 4 year.
In 1999, the applicant from the European nations stood at the highest with 30,000 application and steadily decline in next four year
to the around 12,000 in the year 2003, in contrary to that applicant from the middle east in initial year of 1999 were at around 10000 and increasing
unwaveringly upto 2001 with number of application around 15000, and then experience some suddened decline of about 2000 addmission, then increase sky rocketed
to 20000 at the end of the period.
Come to the applicant from the Far east, intially applicant were around 15,000 then steadly move upword for next five year with double the number of applicant in 2003
, finally for the applicant from africa almost remain same for three year with application around 3000 then steadily increase in next two years with 6000 application in 2003