The table below shows the percentage of the population and the types of houses they live in 3 areas of a city. Summarise the information by selecting and reporting the main features and make comparisons where relevant.
Buy our IELTS graphs book here
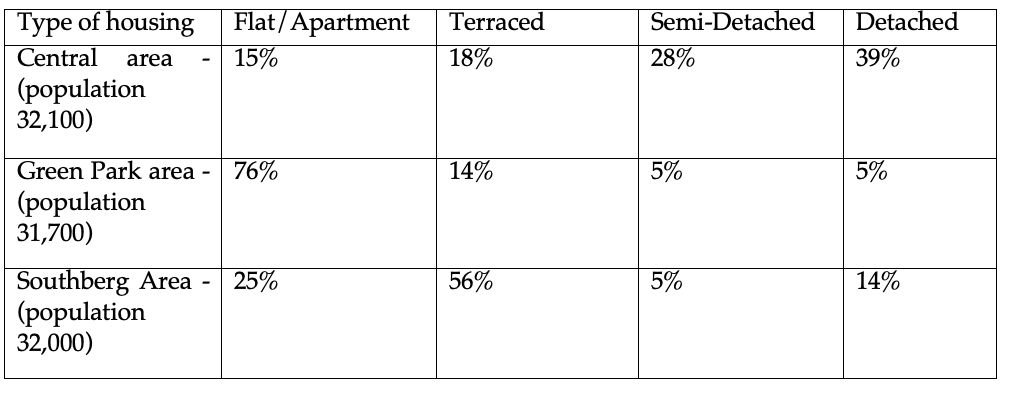
The given table compares the population and housing preferences among three areas of a city.
Overall, it is clear from the graph that the population of the three areas is nearly the same. However, there is a considerable difference in the choice of housing, with the maximum residing in detached housing in the Central area, in flats/ apartments, in the Green Park area, and in terraced housing in Southberg Area.
All three areas have a population of roughly 32000. Out of the three areas, flats are the most popular in Green Park and 76% percent of the Green Park population lives in them. By contrast, only 25% of the Southberg inhabitants and 15% of Central area inhabitants live there. Terraced housing is the most preferred by Southberg Area, with a sizable majority (56%) residing there, while only about 15% of the residents in the other two areas like to live in them.
Semi-detached and detached housing, on the other hand, are liked more by Central area residents as compared to the other two areas. 28% of the Central area residents reside in semi-detached housing. By comparison, a mere 5% of residents in Green park and Southberg area live in such houses. In regard to detached housing, the figures stand at 39% for the Central area, 14% for Southberg area, and only 5% for Green Park.
I want to order this book