The chart below shows the amount of energy generated from wind in four countries from 1985 to 2000. Summarise the information by selecting and reporting the main features and make comparisons where relevant.
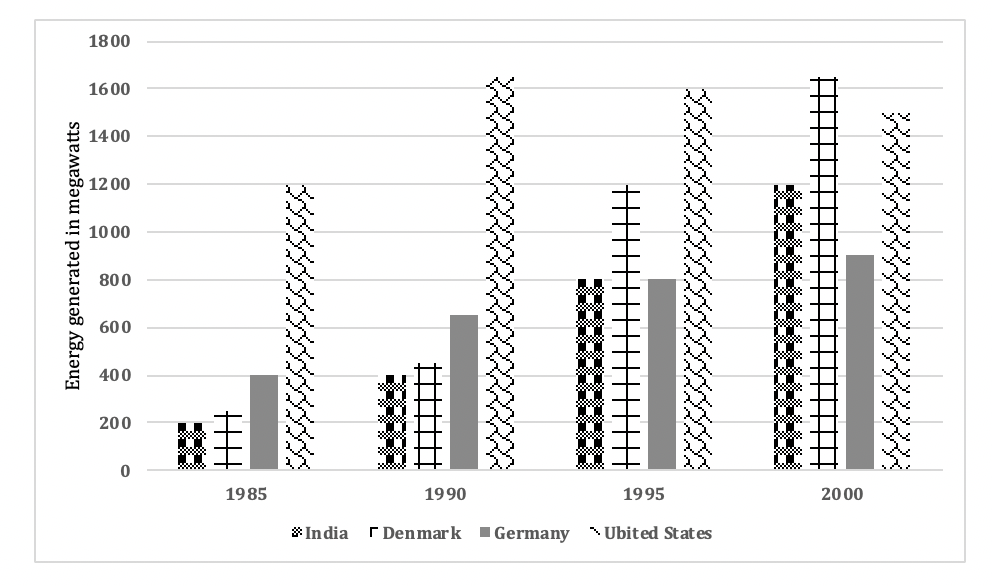
The bar graph compares the wind energy production in four countries, India, Denmark, Germany and the US between 1985 and 2000.
Overall, initially the US was the leader in wind energy production, but with time all the countries except the US showed considerable growth in wind energy production. Also, Denmark experienced the most significant expansion among all the given countries.
In 1985, the US produced approximately 1200 megawatts of energy from wind. Wind energy production in India and Denmark was nearly the same at 200 megawatts and about double this amount was produced from wind in Germany. In India and Denmark, there was a substantial increase over the 15 year period and in 2000, nearly 1200 megawatts were produced from wind in India, while about 1600 odd megawatts were generated from wind in Denmark.
Germany also witnessed a growth but not as significant as India and Denmark and in 2000, its wind energy production stood at about 900 megawatts. The US was an exception as its energy production increased to 1650 megawatts till 1990, but afterwards its production fell slightly by about 100 megawatts in the last five years.
INDROOPMAKKAR@gmail.com Plz give me feedback to my above answer which I uploaded before ths comment give me feedback as bands how I can scored on the writing ??
Done.
8 Bands
The vertical bar graph depicts the data of energy give rise from natural resource, wind in India,Denmark,the United States and Germany throughout the 1985 to 2000
Overall,it can be clearly demonstrated that the US was the largest energy production nation however, after a period of time, a gradual decrease can be seen .Morevover,Denmark have been expanded the production as the second largest nation as compare to the India and Germany.
In addition ,the amount of generation energy from wind in the beginning year 1985 was approximately 200MW of both the countries India and Denmark.Meanwhile ,both got risen their abilities and in mentioned further years until 2000,they gave rise highest amount of energy production respectively, Denmark had produced near about 1620Mw likewise ,India had generated 1200MW of energy.
Besides that the Us fluctuated in its production like the amount figured highest since 1985 to 1995.Alternatively, in next five years ,it became the second largest energy generation nation from wind .Other Germany can show its figures very remarkable ,we can be seen vivdly ,a gradual increment took place in the following mentioned years.
There are many mistakes and I would rate this graph at 5.5 , I am sorry I don’t have time for detailed feedback as I am busy with online classes.
Please evaluate my task.
The given bar graph illustrates the quantity of tidal energy produced in India, Denmark, Germany and the US between 1985 and 2000.
Overall, except the US, increasing trend was experienced by rest of three antions. It is interesting to note that United States was the major producer of wind energy.
In details, the US notched the top slot in initial year by producing 1200 MWh from wind which inclined by around 420 MWh after 5 years. Although the figures declined to 1600 MWh in 1995, it was still intacting its position. In the last year, however, it was replaced bt Denmark and the figures of US remained approximately 1500 MWh. Turning to the least energy generator, India, the numbers in this case went up continuously from 200 MWh to 1200 MWh. Interestingly, the generation of energy increased by 200 MWh in first year whereas the pace doubled and production rose by 400 MWh after every 5 years.
As per Denmark and Germany, the amount was nearly 200 MWh and 400 MWh, in 1985, respectively. In the last year, substantial rise was shown by former by levelling off at slightly above 1600 MWh, by contrast, latter, by showing moderate growth, reached at around 900 MWh.
Can you please score my essay.
The following bar graph illustrates information about the quantity of energy produced from wind in four specific regions between 1985 to 2000.
Overall, the production of energy increased in all four parts of the world throughout the years remarkably in Denmark. However, in 2000, the U.S energy production reduced to some minimal rates.
Firstly, if we take a glance at the figure of 1985, the U.S was the leading country to generate energy with 1200 megawatts. Whereas, the German yield 400 megawatts and India (200 megawatts) which is the lowest production rate in the whole chart. The same pattern followed in 1990 where the U.S produced massive 1600 megawatts of energy from wind.
However, in 1995, India and Germany generated same amount of energy I.e 800 megawatts and interestingly, Denmark production grew dramatically to 1200 following the U.S (1600megawatts). But after a half-decade. In 2000, Denmark leads the production followed by U.S, India and then Germany. Germany seems to be the slowest growth rate as compared to other countries.
Tenzin make your writing simple. It is very confusing to read and for that reason it wont fetch you good bands.
For example you start with 1985, but you don’t talk about Denmark. I would suggest you to attempt it like a Line graph.
Can you evaluate my essay pls ..
The given bar graph illustrates the energy production of four different countries over the period of fifteen years. The numbers are calibrated in megawatts.
It is lucid from the graph that the energy generated by India, Denmark and Germany has shown a significant rise from 1985 to 2000 whereas the generation of energy by United States shows a fluctuation during the same.
India evidents a sharp increase as the energy produced is six times more than it was in 1985. However, the production by Denmark outnumbered India by 400 approximately, in 2000. Steep rise can be seen with regard to Germany as it produced double the energy at the end as compared to initial years. On the other hand, United States was at the top in 1985 as it generated 1600 of energy but the trends fluctuated with a tapered decrease at the end of the period.
All in all, it is vivid that except for United States, a considerable growth is observed in all the three countries where Denmark bagged the first position and last position was bagged by German.
Your tenses are wrong at so many places
Secondly, please don’t go for two overalls.
Moreover,it is very confusing to read your graph. Make it simpler.
There is lack of data. Please mention it.
Overall, this will fetch you 5.5.
The bar char illustrates the power generation form wind in four different countries they are India,Denmark,Germany,United States for a fifteen year period from 1985 to2000.
In 1985,the Us was the highest power producers compared to all other countries with 1200 megawatts of energy and,the least was the india with only 200 megawatts.coming to denmark it has the start by producing 250 megawatts and germany produced 400 megawatts.
Us has the considerable increase up to 1990 by reaching the highest peak of 1650 megawatts.After that the us has a slight fall in the production and by 2000 it has reached 1500 megawatts.
India has the continuous rise in the production of power over 15 years of period and it has generated 1200 megawatts by 2000.and the biggest change was in the production of wind energy in Denmark started with only 250 megawatts and got a peak in the year 2000 with 1650 megawatts of production
However,the germany has the rise in every five year period but in the end of 2000 it was the least with only 900 megawatts of wind energy generation.
Overall,Us was at the top for the wind energy production.But,expect us all the countries has a rose in wind power generation.and in the year 2000 Denmark was at the top with 1650 megawatts of production.
What band score can i get for my eassy
Your tenses are wrong at mony positions.
Grammar – in the sense of capitalisation is also missing.
Some vocab is also wrongly used. Except – Expect.
This will fetch you 5.5
I scored 7.0 in writing from Amritsar in 18 jan 2020 by writing this .
Example , I remember I wrote ==
United States, on the other hand, accounted for over 200 megawatts energy from wind in the year 1985. Soon, it toped in the chart ,after a decade, before was overtaken from its three proponents also by producing more than 1600 megawatts wind power.
Can I please get a sample of makkar academic writing task 2. Thank you
INDROOP MAKKAR (Can you evaluate my essay)
==============================================
The chart depicts the amount of energy produced from wind in four countries, India,
Denmark, Germany, and the United States in four years starting from 1985 to 2000. Units are measured in megawatts.
Overall, it can be seen that the highest amount of energy was produced by all the countries except the united states in the year 2000 whereas the least amount of energy was produced in 1985. The united states produced the highest amount of energy
in 1990.
In 2000, the amount of energy produced by India was six times that of in the year 1985,
which was only 200 megawatts. The amount of power produced by Denmark stood at slightly above 200 megawatts in 1985. This figure gradually increased to reach a peak of slightly above 1600 megawatts in 2000.
The amount of energy generated by Germany in the year 1985 is 400 megawatts. Over the
years, this count increased by more than double to reach a figure of above
800 megawatts in the year 2000. In 1985, the amount of energy generated by the United States
was 1200 megawatts. This number then rose to reach a peak of slightly above 1600 in 1990, before
falling to around 1500 megawatts in 2000.
The chart( mention the type of chart – bar chart) depicts the amount of energy produced from wind in four countries, India,
Denmark, Germany, and the United States in four years starting from(not needed) 1985 to 2000. Units are measured in megawatts.
Overall, it can be seen that the highest amount of energy was produced by all the countries except the united states(capitalisation) in the year 2000 whereas the least amount of energy was produced in 1985.( Here the trend- should be increase, rather than highest) The united states(capitalisation) produced the highest amount of energy
in 1990.
In 2000, the amount of energy produced by India was six times that of in the year 1985,
which was only 200 megawatts.( always start with the the first year, it confuses the examiner if you do it the opposite way) The amount of power produced by Denmark stood at slightly above 200 megawatts in 1985. This figure gradually increased( increased gradually – adverb follows the verb) to reach a peak of slightly above 1600 megawatts in 2000.
The amount of energy generated by Germany in the year 1985 is( was) 400 megawatts. Over the
years, this count increased by more than double to reach a figure of above
800 megawatts in the year 2000. In 1985, the amount of energy generated by the United States
was 1200 megawatts. This number then rose to reach a peak of slightly above 1600 in 1990, before
falling to around 1500 megawatts in 2000.
You lack comparison in your detail, bring out the fact that there was a fall in the US- contrast it properly, otherwise your grammar is quite good, the overall needs work.
I am sorry, I don’t have the time for the others. Keep working and good luck.
The bar chart compares the amount of wind energy generated by India, Denmark,Germany and United States between the period of1985-2000.
It can be clearly inferred that in 1985 out of the four countries United States had the maximum capability to produce wind energy, generating nearly 1200 megawatts and second nearest being Germany producing 400 megawatts of wind energy. But in the succeeding fifteen years the whereas the wind energy production capacity of other 3 countries has increased drastically, United States have reached their saturation level with production fluctuating between 1500-1600 megawatts.
The wind energy production capacity of India in 2000 has become 6 folds of the figure it was in 1985, increasing from 200 MG to 1200 MG. Similarly, Denmark has also invested heavy in this sector augmenting their capacity from 250 MG in 1985 to 1600 MG in 2000.
The production capacity of Germany has also been on a rise increasing from 400 MG in 1985 to 850 MG in 2000 but the rate on increament has been more steady in comparison of the other two counterparts ,
plz evaluate.
can we write the conclusion at 2nd ??
yes
The given bar chart represented with the information of wind energy generation from the year 1985 to 2000 in the four different countries namely India, Denmark, Germany
and the United States.
Overall, the us was the leader in the wind energy generation, but with time all the countries except the US showed a considerable growth in wind energy production.
Also, Denmark experienced the most significant growth among all the given countries.
In 1985, with 1200 megawatts generation the US was the highest producer among the all the given four countries and remain till 1995 with production about 1600 megawatts then in later year 2000 energy production decline by around 100 megawatts to 1500 megawatts.In the case of Germany starting from 400 megawatts in 1985 to the about 900 megawatts in the year 2000 showed a unwavering increase throughout the given period.
Coming to the Denmark, which was at about 250 megawatts in 1985 showed a rocketed boost through out the period with surpass the the US in 2000 by difference of 120 megawatts with 1620 megawatts generation in the year 2000.Finally India, started with production of energy with capacity of 200 megawatts showed a steady increase up to 1995 with same production capacity as Germany with production of 800 megawatts energy, also in the next five year surpass the Germany by 300 megawatts additional generation with 1200 megawatts in the year 2000.
Jaydeep you want it evaluated?
Please work on your tenses – represented- represents.
Capitalisation.
Vocabulary usage wrong – unwavering, rocketed boost.
Preposition- Improper usage of with at many places.