The graphs below show the cinema attendance in Australia and also show the average cinema visits of different age groups from 1996 to 2000. Summarise the information by selecting and reporting the main features and make comparisons where relevant.

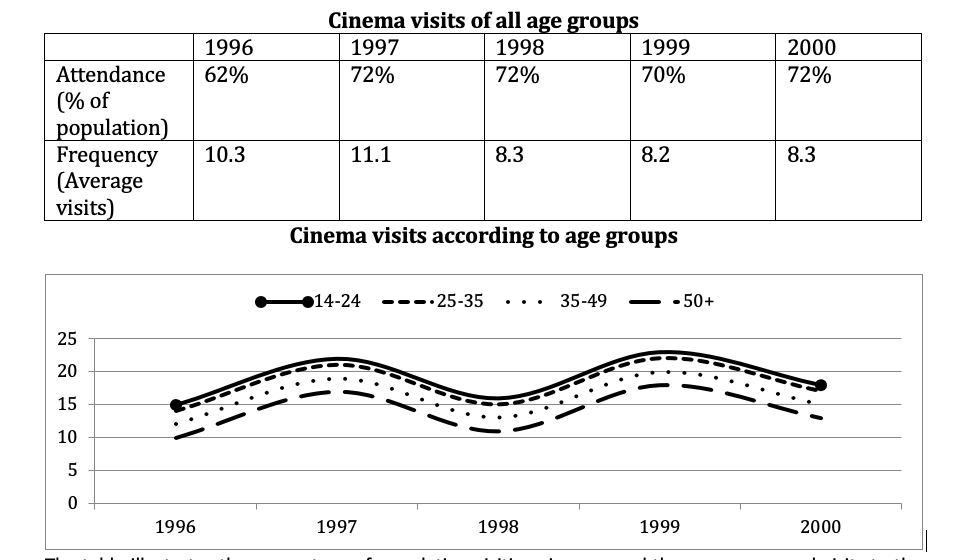
The table illustrates the percentage of the population visiting cinemas and the average annual visits to the cinema, whereas the line graph compares the cinema visits according to different age groups from 1996 to 2000, in Australia.
Overall, the percentage of people attending the cinema increased, whereas the average annual visits decreased over the given time. In general, all age groups followed a similar trend and the yearly visits to cinemas fluctuated from 1996 to 2000. The 14-24 year olds were the most fond, but those over 50 were the least fond of cinema.
In 1996, 62% people went to cinema. This percentage rose sharply to 72% by 1997, but after that remained fairly stable till 2000. The average yearly visits stood at 10.3 in 1996. This figure went up minimally to 11.1 by 1997. In the next year, there was a fall in the cinema visits and then the number stabilised at nearly 8.3 till 2000.
In 1996, the number of visits to the cinema were between 10 and 15 /year for all the age groups, with the older age group visiting cinema slightly less than the younger age groups. All the age groups followed the same trend with the number of visits fluctuating from 10 to 25/year over the rest of the given period.
Written by: Indroop Singh


Hello, I have a small question. How is this graph possible logically? I mean in the table, the figures in the year 2000 compared to 1999 were higher in both aspects, but in the line graph, the trend shows the opposite, which I find hard to understand why it’s possible. I know this is not directly related to IELTS but it does affect how we group and organise ideas. Hope I’d receive your answer. Thank you
Because they are different things.
thanx for sharing the strategy of writing task 1 of different categories…
Very impressive written skill
Thank you