The graph below shows cinema attendance by age in Great Britain. Write a report for a university lecturer describing the information shown.
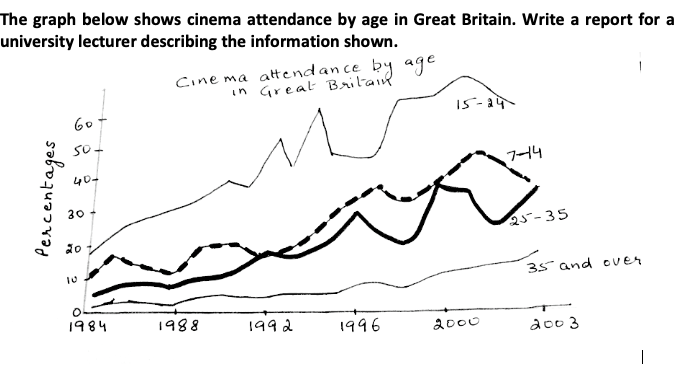
The given line graph illustrates the percentage of people of different age groups who attended cinema from 1984 to 2003.
Overall, cinema attendance grew in all age groups in the given period of time. Also, in general, the younger age groups had a higher percentage of cinema visitors than the older age groups.
From 1984 to 2003, cinema attendance rose considerably across all age groups, but the increase was the greatest for the 15-24 age groups, which rose from about 18% in 1984 to over 50% in 2003. Though the figures fluctuated between 1992 and 1998, this age group still went to the cinema more than any other age group.
There was also a substantial rise in cinema attendance among older people (35 plus). In this case, the figures increased over this period from about 2% to over 10%. Cinema attendance of 7-14 and 25-35 year-olds followed a similar pattern from 1984 to about 2002, which was characterized by some fluctuations throughout. However, from 2002 the trends differed in that 7-14 year olds went to the cinema less frequently while cinema attendance of the 25-44 year olds was on the increase.
Where i can buy this book?
Dear admin, please share more academic reading for practice
Hii
Can uh guide me from where i can but the latest book of reading academic
as due to lockdown i am unable to buy from market
Hello ma’am, I’m not sure if you make writing (task 2) guesswork pdf, if yes, where can i find it?
I am sorry, we don’t release that. Our guess work depends varies from exam to exam. Its not possible to share the whole guesswork as a pdf.
Ohh, any chance to get some important topics in writing?
From where I can get makkar IELTS cue cards may to Aug 2020?
Cue cards will be delayed. You can refer to our January 2020 cue cards.
How much band answer it is
Can we right conclusion too at the end
yes
yes you can….
Good
how much it cost ?
320
How can i download makkar book of graph?
Sorry, there is no pdf, you can buy the paperbook from the market.