IELTS Academic Essay 11th Jan 2020
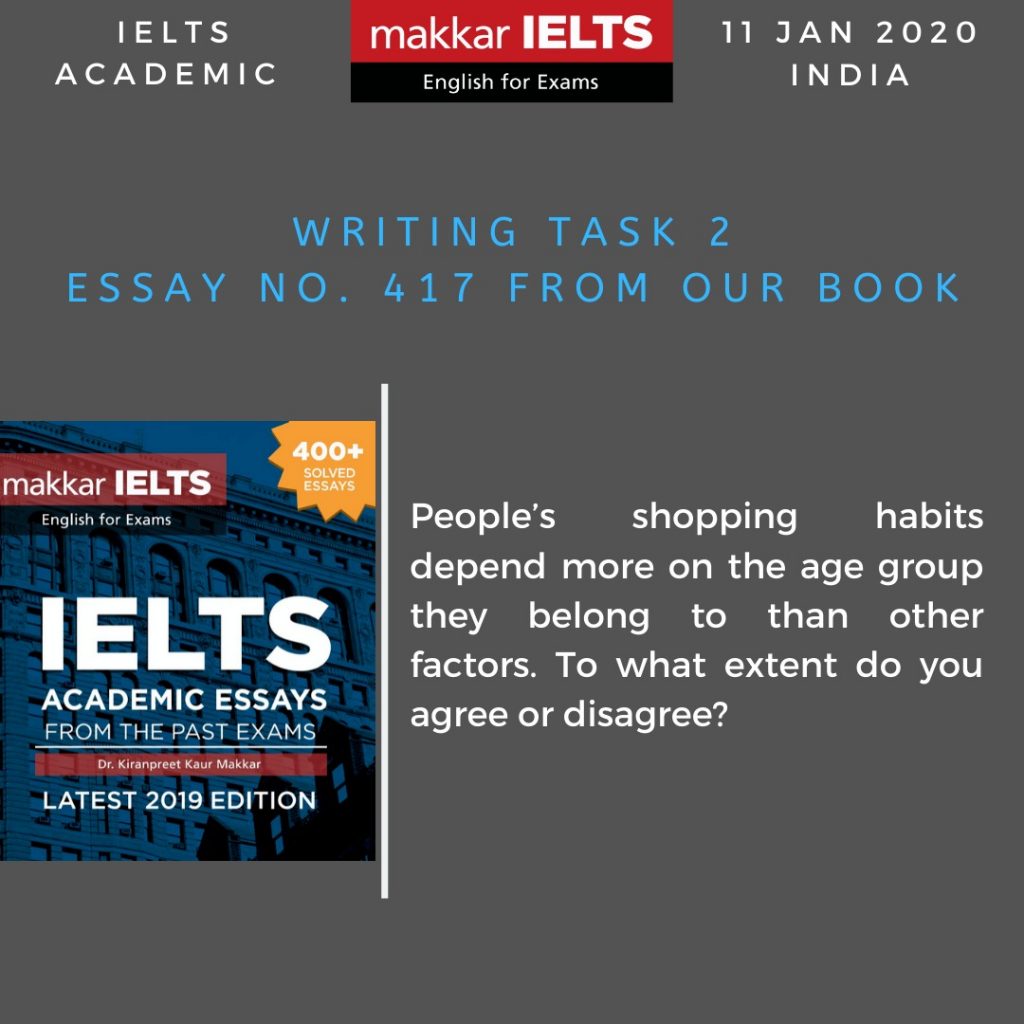
People’s shopping habits depend more on the age group they belong to than other factors. To what extent do you agree or disagree? I disagree with the given statement, which says that the age of a person is the main determinant of consumer behaviour. I believe that apart from age, there are numerous other factors, […]
IELTS Academic Essay 11th Jan 2020 Read More »


