Bar Graph

IELTS Task 1 Academic Graph 6TH JULY 2022 India 9AM

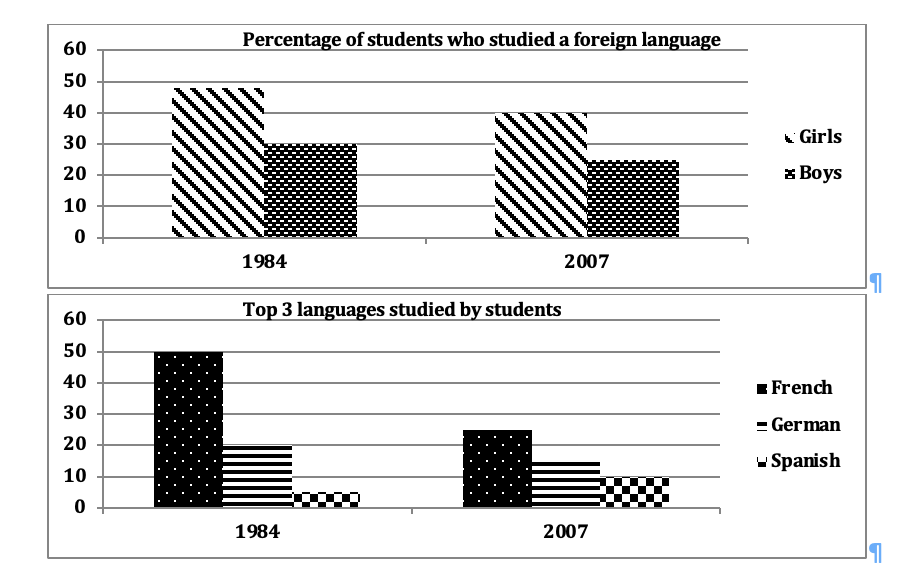
The two bar charts show the proportion of 14-16 year-old students studying a modern foreign language in an English speaking country, and the top three popular foreign languages. Summarize the information by selecting and reporting the main features and make comparisons where relevant. Graph 55 from our book The given bar graphs illustrate the percentage […]

IELTS Task 1 Academic Graph 6TH JULY 2022 India 9AM Read More »

IELTS Academic Task 1 21st August 2021 India 9AM

The chart below gives information about adults with education at high school level in six countries in 2010. Summarise the information by selecting and reporting the main features and make comparisons where relevant. Percentage of 55-64 year-olds and 25-34 year-olds with education at high school level, 2010 The bar chart illustrates the proportion of 25-34

IELTS Academic Task 1 21st August 2021 India 9AM Read More »

IELTS Academic Task1 10th Oct 2020 India 9 AM

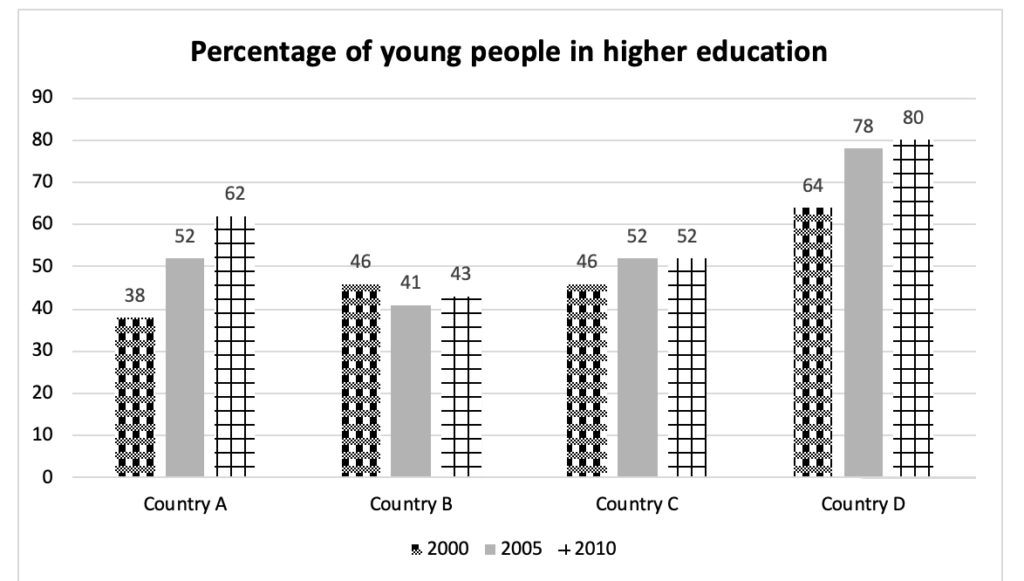
The chart below shows the percentage of young people in higher education in four different countries in 2000, 2005, and 2010. Summarise the information by selecting and reporting the main features and make comparisons where relevant. Buy our IELTS graphs book here The bar chart illustrates the percentage of youth in higher education in four

IELTS Academic Task1 10th Oct 2020 India 9 AM Read More »

IELTS Academic Task1 12th September 2020

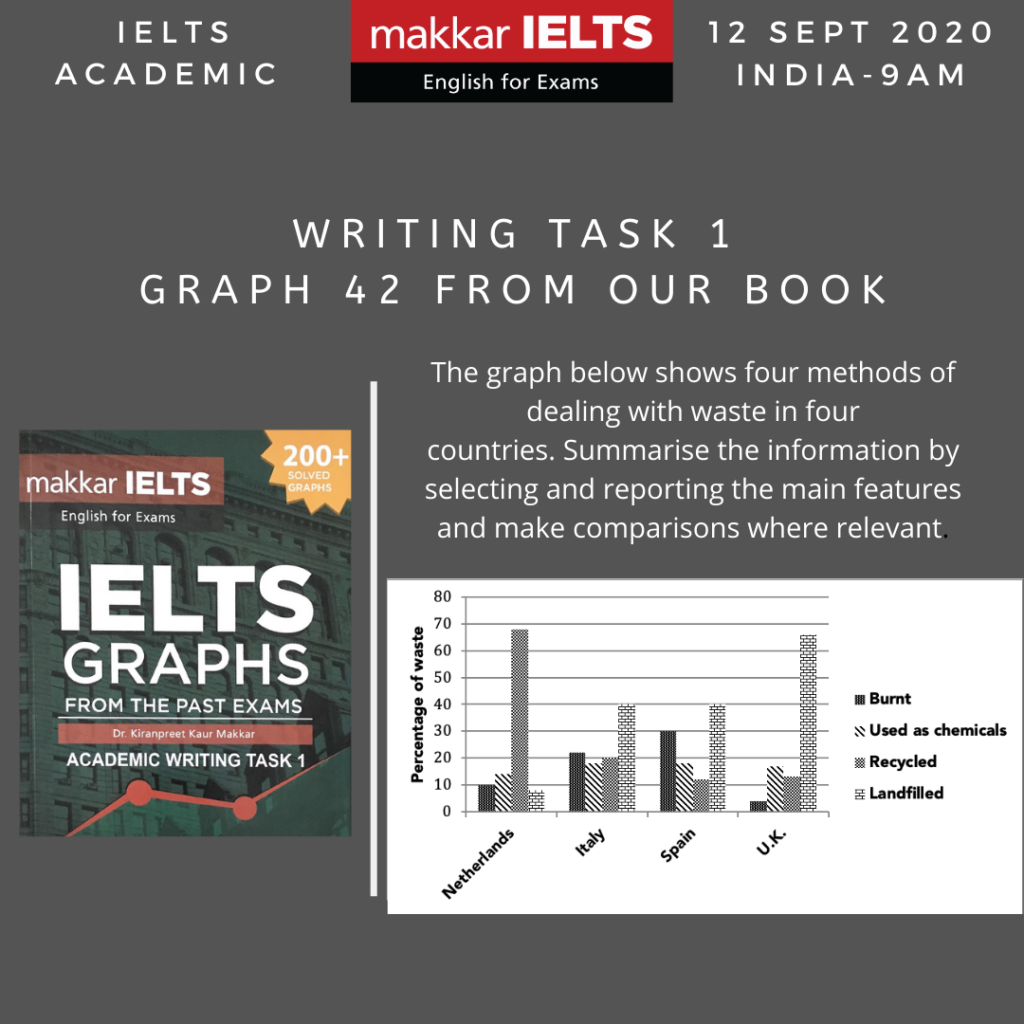
The graph below shows four methods of dealing with waste in four countries. Summarise the information by selecting and reporting the main features and make comparisons where relevant. The given bar graph illustrates the data on four different waste disposal methods used in the Netherlands, Italy, Spain, and the UK. Overall, it can be seen

IELTS Academic Task1 12th September 2020 Read More »

IELTS Academic Task1 18th January 2020

The chart below shows the amount of energy generated from wind in four countries from 1985 to 2000. Summarise the information by selecting and reporting the main features and make comparisons where relevant.  The bar graph compares the wind energy production in four countries, India, Denmark, Germany and the US between 1985 and 2000. Overall, initially

IELTS Academic Task1 18th January 2020 Read More »

error: Content is protected !!