IELTS Academic Task1 30th November 2019
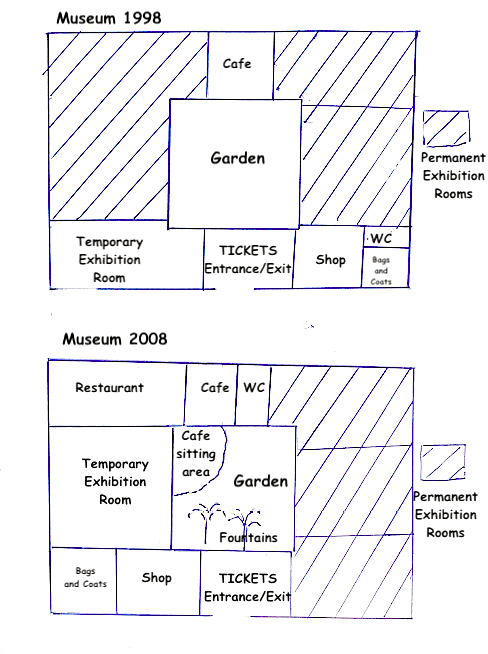
The picture below shows the plan of a museum in 1998 and after some changes were made in it in 2008. Summarise the information by selecting and reporting the main features and make comparisons where relevant. The map illustrates the changes that were made to a museum between 1998 and 2008. Overall, it can be […]
IELTS Academic Task1 30th November 2019 Read More »


