IELTS Academic Task1 17th Sept 2020
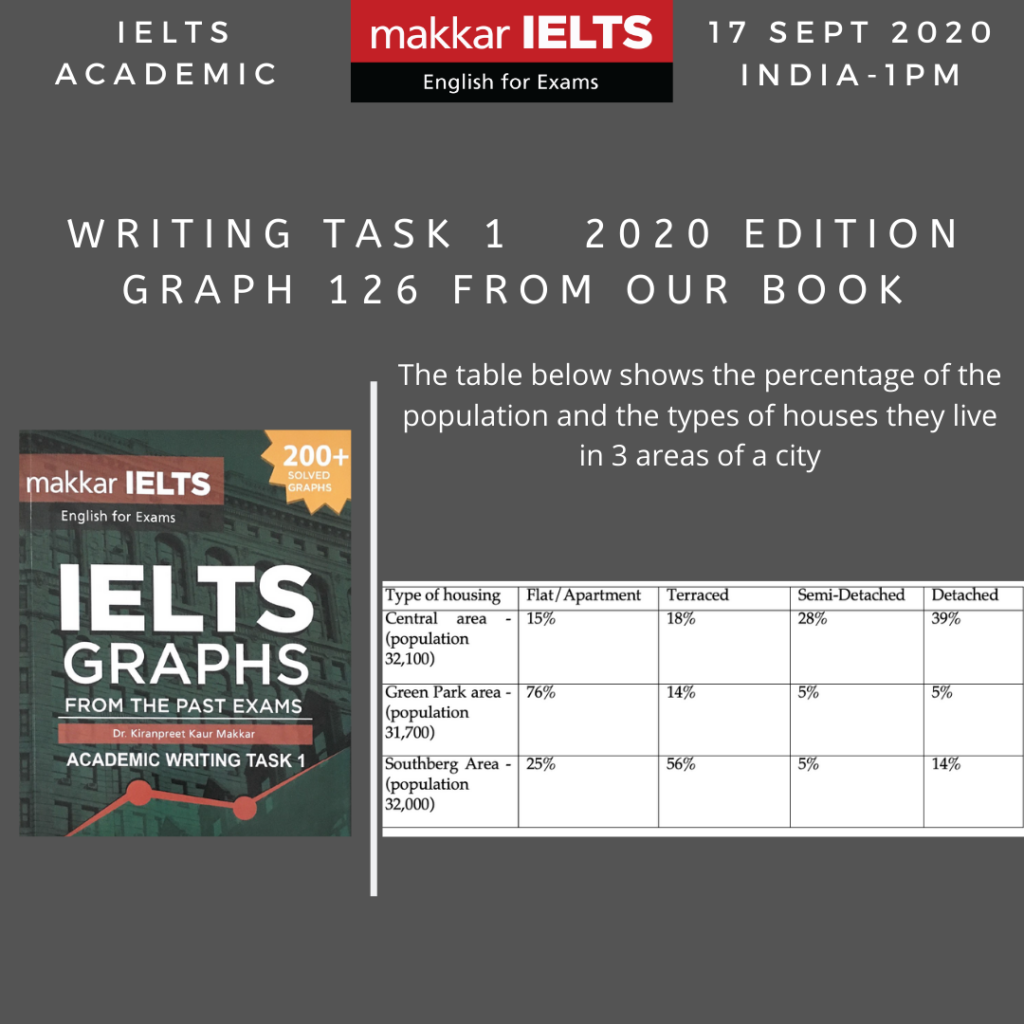
The table below shows the percentage of the population and the types of houses they live in 3 areas of a city. Summarise the information by selecting and reporting the main features and make comparisons where relevant. Buy our IELTS graphs book here The given table compares the population and housing preferences among three areas […]
IELTS Academic Task1 17th Sept 2020 Read More »