Graphs FAQs
Are graphs part of IELTS Academic or IELTS General?
Graphs are the Task 1 in IELTS Academic, while Letters are the Task 1
in IELTS General. If you are confused whether to take IELTS Academic or General
Academic is for further education and General is for Permanent Residency (PR).
What are the types of graphs and which is the most common?
There are seven graph types
- Bar
- Table
- Line
- Map
- Pie
- Process
- Combination of two – like table and bar graph.
The order in which they are written – is also how common they are.
What is an appropriate length for Task 1/Graph?
Lower limit – 150 words
There is no upper word limit- but if you spend more time on graph, you might not be able to complete Task 2. So, try to write less than 200 words.
How many bands for the graph?
The weightage of Task1 (Graph) is one third and Task2 (Essay is two
third). Basically, your bands out of 9 are multiplied by 1/3 in case of Graph
and 2/3 in case of Essay.
For example: If you score 8 in graph and 6 in essay, your score would
be (8+6+6)/3 =6.67 which on rounding off gives 6.5
How much time to spend on the graph?
You can allot the graph your own time out of 1 hour, but ideally
graph should not be given more than 20 minutes.
Repetition and synonyms
Repeating a word two three times- doesn’t result in a big band deduction.
Wrongly used synonym- A comparatively bigger band deduction.
Correctly using synonyms are better than repetition of course. However, repetition is better than using the wrong synonym,
because sometimes a wrong synonym changes the complete meaning of the sentence.
So, don’t overfocus on synonyms, if you don’t know – don’t force and write the wrong ones.
Example: Consequence/Result
Do I need to compare and contrast in each sentence?
No please don’t overuse contrast words because then your graph starts to lose meaning. Ideally total comparisons at four or five places in the whole graph is enough.
Placement of overall?
In short, writing it at the end or writing it after the introduction- both are correct.
I used to write overview at the end because Cambridge books follow this pattern.
However, it looked forced and last year I tried putting the overall in the 2nd paragraph.
This resulted in most of my students scoring better. So now I recommend writing them in the 2nd paragraph after the
introduction.
Is it correct to use data in the overall/overview?
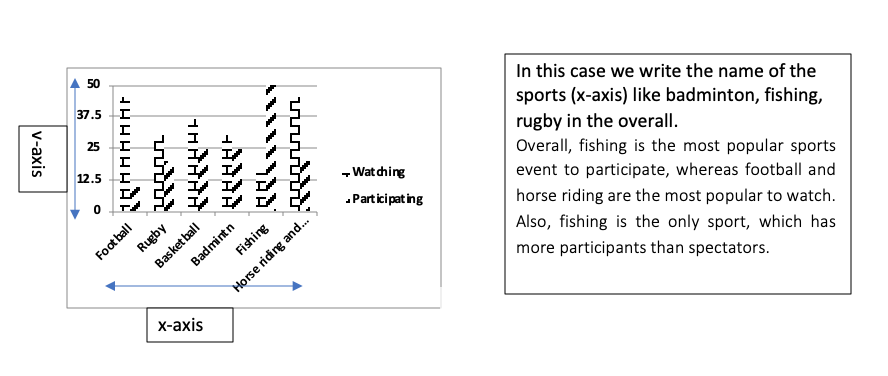
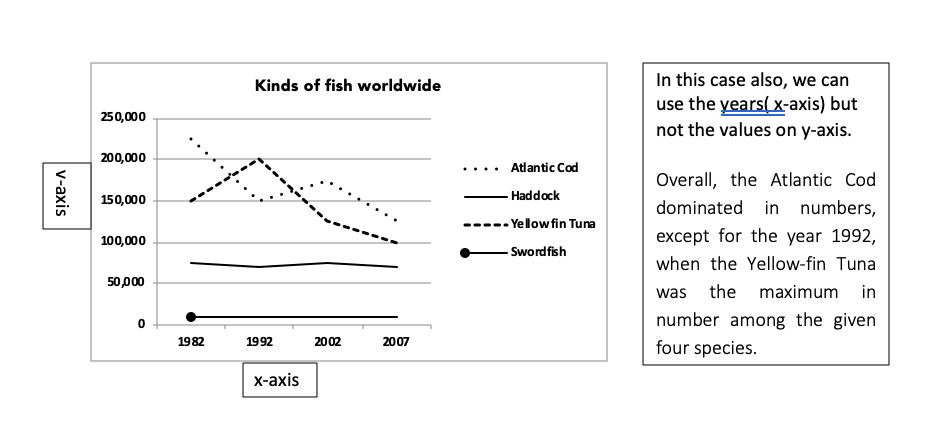
No, data should not be used. But data doesn’t mean what’s written on the x-axis, data are the figures on the y-axis.
Look at the two graphs to understand what I mean.
The column graph shows the percentage of males in a particular country who prefer watching sports to males who prefer participating in sports. Summarise the information by selecting and reporting the main features and make comparisons where relevant.
The chart below shows the number of four different species of fish between 1982 and 2007. Summarise the information by selecting and reporting the main features and make comparisons where relevant.
How many sentences to write in overall?
I believe ideally two sentences is the ideal length. One sentence is too short, and three sentences are too long.
With one sentence- we are not able to give all the features. With three sentences- it starts looking like a body paragraph rather
than an overview.