Let’s start with 3 simple sentences
Sentence 1: Value at a particular year.
Sentence 2: Comparing 3 different values in a particular year.
Sentence 3: Describing a change.
The graph below shows the percentage of people who travelled by bus in the UK from 2009 to 2011. Summarise the information by selecting and reporting the main features and make comparisons where relevant.
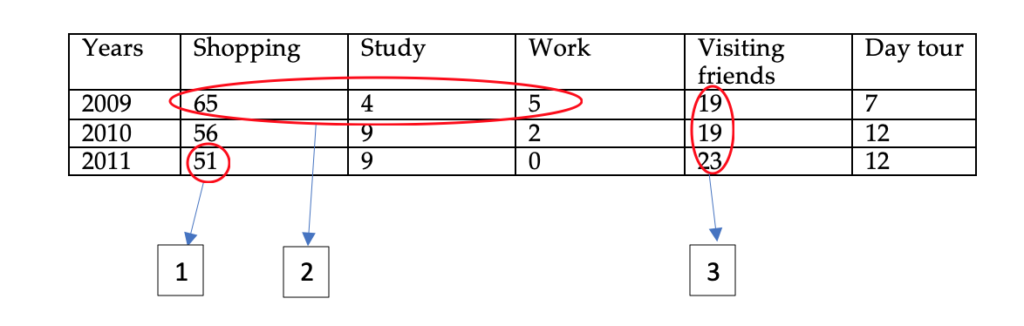
Sentence 1: 65% of people travelled by bus for shopping in 2009. (Simple)
Sentence 2: While 65% of the people travelled for shopping, a mere 5% and 4% of the people travelled for work and study respectively. (Complex)
Sentence 3: The percentage of people who travelled for visiting friends rose from 19% in 2009 to 23% in 2011. (Simple)
Now before we move on – lets practice this again in a line graph.
The graph below shows the number of students from the US, the UK and Australia who studied in universities in other countries from 2002 to 2007. Summarise the information by selecting and reporting the main features and make comparisons where relevant.
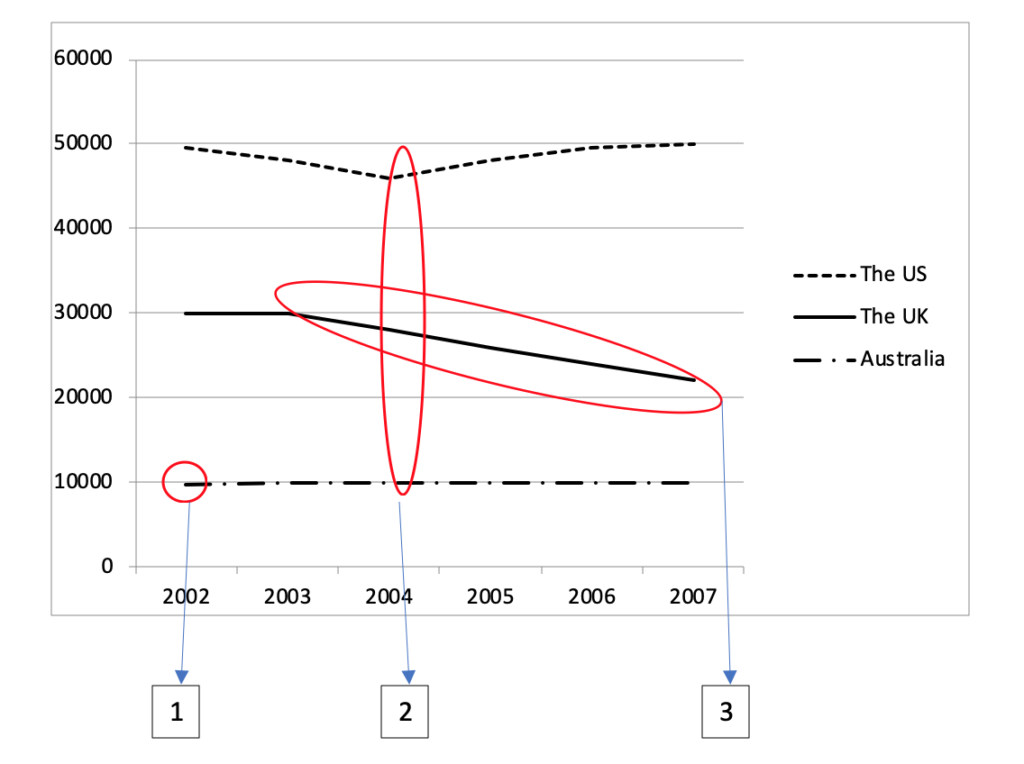
Sentence 1: 10,000 Australian students studied abroad in 2002. (Simple)
Sentence 2: In 2004, the number of American students studying abroad was around 46,000, while the number of British and Australian students was 26,000 and 10,000 respectively. (Complex)
Sentence 3: Between 2003 and 2007, the number of British students studying abroad fell from 30,000 to approximately 22,000. (Simple)
Don’t worry about repetition, focus on grammar. Grammar is always more important. Repetition would not lose as much as marks as wrong grammar.
Moving to Complex Sentences
Let’s first understand where complex sentences are used. Complex sentences are used when we try to give more than one information in a single sentence.
The ‘while’ sentence we used earlier is counted as a complex sentence (in IELTS) because you are comparing data for 2 different things in a single sentence.
For example: While I play cricket, my brother plays football.
You combined
I play cricket.
My brother plays football.
Practicing Complex Sentences
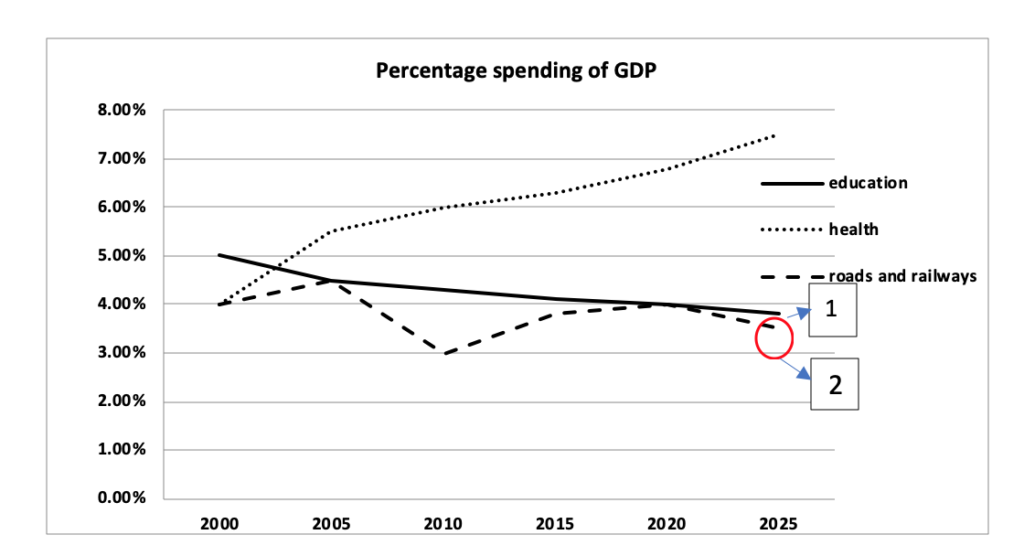
The given graph shows the past and projected figures of the government spending as a percentage of GDP for the years 2000 to 2025 in three areas. Summarise the information by selecting and reporting the main features and make comparisons where relevant.
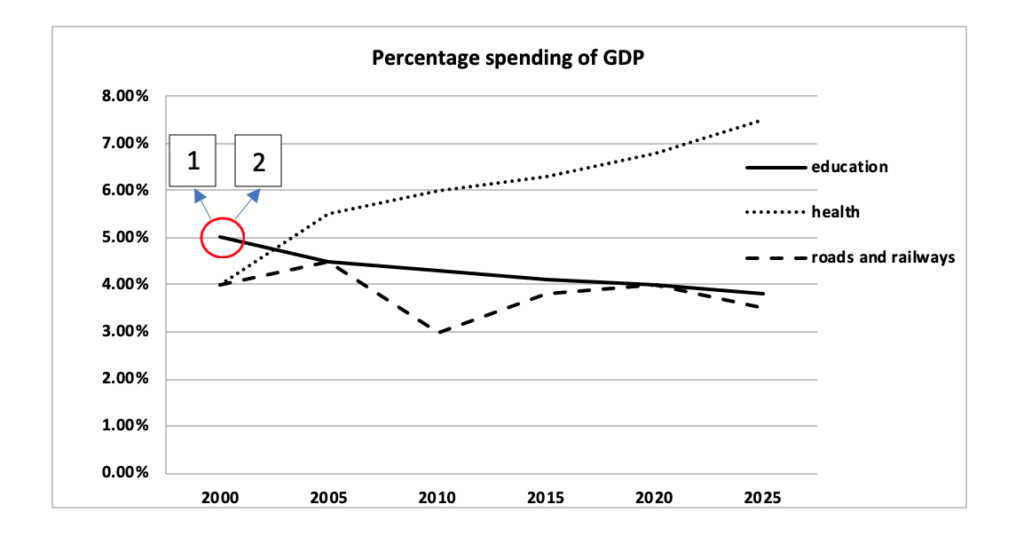
Now let’s imagine you, want to tell 2 things about spending on education in 2000.
1. Spending on education was the highest in 2000.
2. Spending was 5% of the GDP.
If I want to express this, I would be forced to use a complex sentence.
3 different complex sentences to express this
1. In 2000, the spending on education was the highest, at 5% of the GDP. (using at)
2. In 2000, the spending on education was the highest, which accounted for 5% of the GDP. (using which)
3. In 2000, the spending on education was the highest, with a figure of 5% of the GDP. (using with)
2 other ways, not complex
4. In 2000, the spending (5% of the GDP) on education was the highest.
5. In 2000, the spending on education was the highest, and 5% of the GDP was spent on it.
Let’s try it
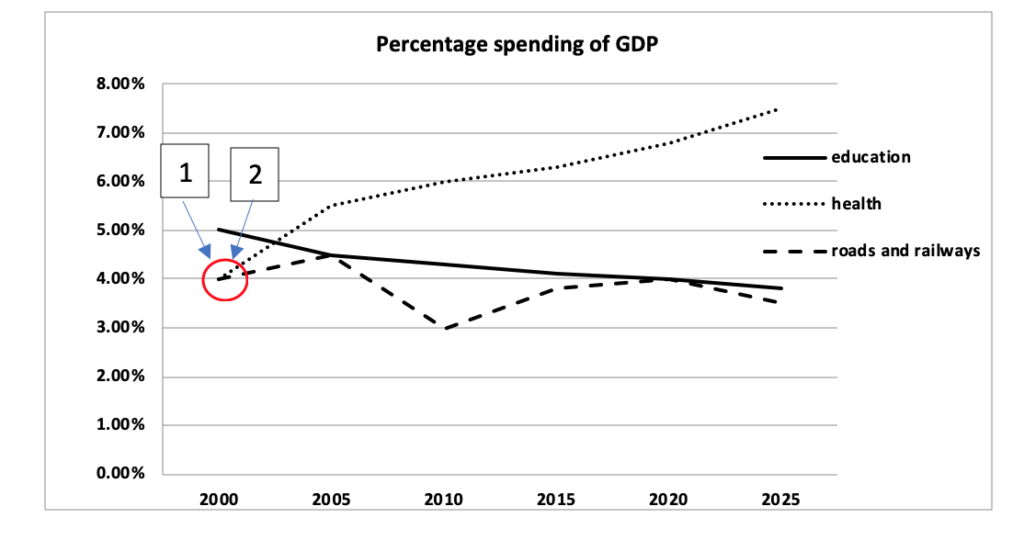
1. Spending on health and roads and railways was the same.
2. Spending on health and roads and railways was 4% of the GDP.
3 different complex sentences to express this
1. In 2000, spending on health and roads and railways was the same at 4% of the GDP.
2. In 2000, spending on health and roads and railways was the same, which was 4% of the GDP.
3. In 2000, government expenditure on health and roads and railways was the same, with a figure of 4% of the GDP for both.
2 other ways, not complex
1. In 2000, the government expenditure on health and roads was the same and it was 4% of the GDP.
2. In 2000, the government expenditure (4% of the GDP) on health, and roads and railways was the same.
Let’s take another scenario.
1. Expenditure on roads and railways is expected to be slightly less than the expenditure on education.
2. Expenditure on roads and railways is expected to be 3.5%.
In 2025, the expenditure on education is expected to be 3.75% of the GDP.
Let’s follow up this line with a complex sentence for expenditure on roads and railways.
1. In 2025, the expenditure on roads and railways is expected to be slightly less than expenditure on education at 3.5% of the GDP.
2. In 2025, the expenditure on roads and railways is expected to be slightly less than expenditure on education, with a figure of 0.25% less.
Now let’s make a super complex sentence, let’s use while for Sentence A and the complex sentence 1/2.
In 2025, while the expenditure on education is expected to be 3.75% of the GDP, the expenditure on roads and railways is estimated to be slightly less at 3.5% of the GDP.
I will end on this note:
Make 2 to 3 complex sentences in your graph at the most. More complex sentences don’t mean more bands. Your graph should be a mixture of both complex and simple sentences.
Very important lessons and techniques…
Thank you mam to bring these opportunities ❣️💚❤️
Helpful lesson, I really appreciate it.
Hello, mam how to use adj + noun structure in task 1.
mam video was excellent and very help full. please give same like on written task 2. please mam.
YoUr Explanation Was Excellent
Thank you
Very very helpful lessons…mam u teach in a very easy way to understand…what a technique….! Thank u so much mam for teaching meaningful lessons…it will be very helpful for me for exam of 16 th September…🙏
Really good lesson
Thank you
It’s help full ma’am please make new pdf on essay writing , I don’t know about grammar ma’am please help me ??
really helpful, thanks a lot for providing great information