Line graphs are common in Ielts Academic writing task 1 along with other graph types like Maps, Bar graphs, Pie Charts and Tables.
Boost your IELTS score by following these guidelines for line graph
Your answer should focus on the following:
- Introduction
- Overall
- Body paragraphs
- Comparisons – special focus
Let’s look at the whole process step by step as we analyze the example graph below.
Writing the introduction
Step 1: Look at the question and then look at the diagram and try to understand what the data means.
For example, from this graph we understand that how many 18-25 year adults were studying at universities in these Countries.
Step 2: To better understand speak out 1 line with data.
In 1961, 25% of 18-25 year olds in Thailand were enrolled in universities.
Step 3: If you know you can say this in some other words do it, if not just add something from the diagram and write the introduction.
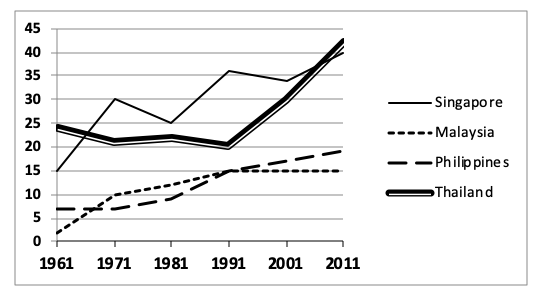
The line graph illustrates the percentage of 18-25 year olds enrolled in tertiary education programs in four countries from 1961 to 2011. (With paraphrasing)
or
The line graph illustrates the percentage of 18-25 year olds studying at universities in Thailand, Singapore, Malaysia and Philippines between 1961 and 2011. (Without paraphrasing)
Sentence 1: Introduction ( done)
Writing the overall – 2 Sentences – Sentence 2 and 3
Overall – we will write two sentences.
Sentence 2 (Sentence 1 of overall):
Step 1: Find out the maximum/highest. (Which means the line at the top ).
In this case :
From 1961 to 1965 – It is Thailand.
From 1965 to 2008 – It is Singapore.
After 2008 – It is again Thailand.
(It is clear that for majority of the time period, it is Singapore).
Step 2: Understand what the line means.
In this case: The line doesn’t represent Thailand, but rather proportion of 18-25 year olds from Thailand, Singapore studying at universities.
Step 3: Write this as your overall ‘Sentence 1’.
Overall, it can be seen that Singapore had the highest proportion of 18-25 year olds studying at universities for majority of given time period.
Sentence 3 ( Sentence 2 of overall):
Step 1: Figure out the trend for all by looking at the initial data and final data.
For example in this case
Thailand – Initial 25, Final 40+ Trend – Increase
Singapore – Initial 15, Final 40 Trend – Increase
Malaysia – Initial 2, Final 15 Trend – Increase
Philippines- Initial 7, Final 20 Trend – Increase
Step 2: Write this as sentence 2 of overall.
Also, there was an increase in the proportion of 18-25 year olds opting for higher education in all the given countries.
Till now 3 Sentences :
The line graph illustrates the percentage of 18-25 year olds enrolled in tertiary education programs in four countries from 1961 to 2011.( Introduction – Sentence 1) Overall, it can be seen that Singapore had the highest proportion of 18-25 year olds studying at universities for majority of given time period. Also, there was an increase in the proportion of 18-25 year olds opting for higher education in all the given countries. ( Overall- Sentence 2 and 3.)
Writing the Body Paragraphs
For Body Paragraphs 1 and 2: Divide the Graph into 2 halves.

Body Paragraph 1:
Sentence 4/5: Data for 1961.
Sentence 6/7:Trends from 1961 to 1991.
Step 1: Give initial data for every country ( Data for 1961).
Step 2: Try to use a contrast word while giving data. (While, Whereas or By contrast.)
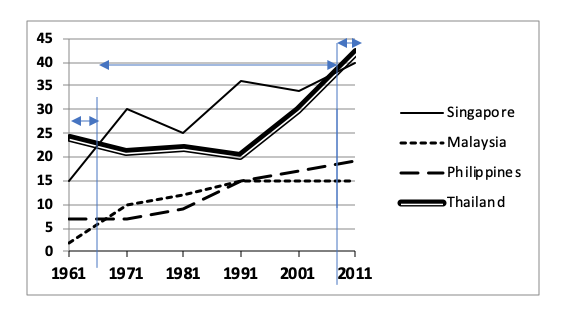
In 1961, the proportion of 18-25 year Thais enrolled in university was 25 and it was followed by Singapore at 15%. ( Sentence 4)
By contrast, the percentage of 18-25 year olds studying at universities in Philippines and Malaysia was only 7% and 2% respectively.( Sentence 5)
Step 3: Try to explain the trend till 1991.
Step 4: Use comparison word while giving trends
From 1961 to 1991, there was a slight decrease in the proportion of 18-25 year olds from Thailand studying at universities, while the proportion increased slightly to around 15% for both Malaysia and Philippines. ( Sentence 6)
In Singapore also, the proportion rose but with fluctuations and in 1991, about 35% of 18-25 year olds were enrolled in universities.( Sentence 7)
Body Paragraph 2:
Sentence 8: Write trends from 1991 to 2011.
Sentence 9: Write final year data.
Step 1: Write trends from 1991 to 2011
Step 2: Use comparison words while writing trends.
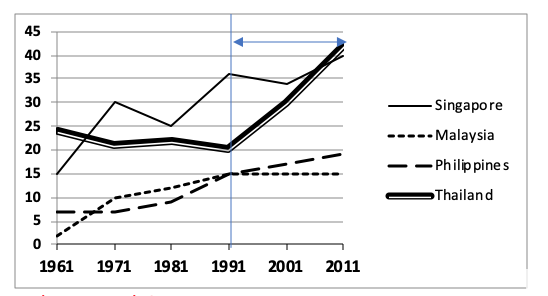
Over the last two decades from 1991 to 2011, the proportion of Singaporean, Filipino and Thai 18-25 year olds went up, whereas the figure in Malaysia remained unchanged. (Sentence 8).
Step 3: Write the final year data.
Step 4: Use comparison words when giving data.
In 2011, the percentages of 18-25 year olds studying at universities stood at around 40% in Singapore and Thailand, while the figures for Philippines and Thailand was considerably lower at 15% and 10% respectively. ( Sentence 9)
The complete graph
The line graph illustrates the percentage of 18-25year olds enrolled in tertiary education programs in four countries from 1961 to 2011.
Overall, it can be seen that Singapore had the highest proportion of 18-25 year olds studying at universities for majority of given time period. Also, there was an increase in the proportion opting for higher education in all the countries.
In 1961, the proportion of 18-25year Thais enrolled in university was 25 and it was followed by Singapore at 15%. By contrast, the percentage studying at universities in Philippines and Malaysia was only 7% and 2% respectively. From 1961 to 1991, there was a slight decrease in the proportion from Thailand studying at universities, while the proportion increased slightly to around 15% for both Malaysia and Philippines. In Singapore also, the proportion rose but with fluctuations and in 1991, about 35% of 18-25year olds were enrolled in universities
Over the last decades from 1991 to 2011, the proportion of Singaporean, Filipino and Thai 18-25year olds went up, whereas the figure in Malaysia remained unchanged. In 2011, the percentages studying at universities stood at around 40% in Singapore and Thailand, while the figures for Philippines and Thailand was considerably lower at 15% and 10% respectively.
Checkout more examples of Line Graphs here
Buy our IELTS graphs book here
Listen to our video for a detailed lesson on IELTS Line Graphs

Excellent 👍 i really find line graph very hard but now it became very easy for me Thank you for uploading this 😊
Very helpful and brilliant work.
Thank you for uploading this on your web site.
I liked it really easy and simple language thank you mam