Table in less than 10 Sentences
- Introduction
- Overall
- Body paragraphs
- Comparisons – special focus
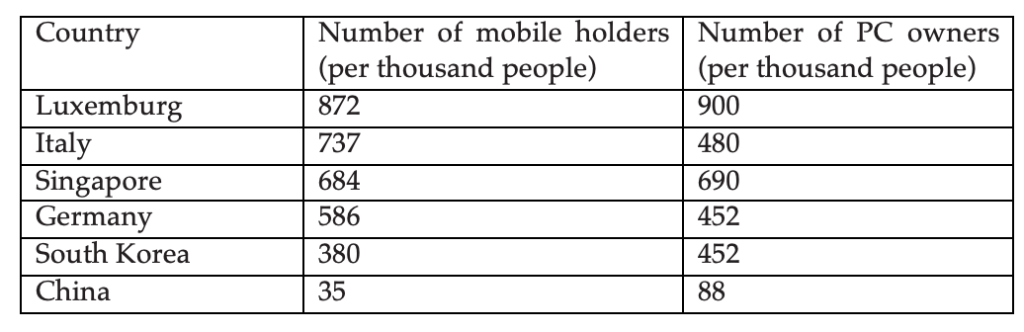
The table shows the number of mobile phones and personal computers per 1,000 people in 2003 in 6 different countries. Summarize the information by selecting and reporting the main features and make comparisons where relevant.
Writing the Introduction – Sentence 1
Step 1: Read the question carefully, look at the diagram and understand the data given.
In this case, in the question it mentions mobile phones and PCs, but when we look at the diagram it’s becomes clear that it’s not mobile phones but mobile owners and PC owners.
Step 2: Try paraphrasing if possible, else just make minor changes and form an introduction.
The table graph illustrates the number of people per thousand who possessed mobiles phones and personal computers in six countries in 2003. (Sentence 1).
Note: I could have mentioned countries but that would have made the introduction too long. So, make the judgment according to length.
Writing the overall – 2 Sentences – Sentence 2 and 3
Overall – we will write two sentences.
Sentence 2 (Sentence 1 of overall):
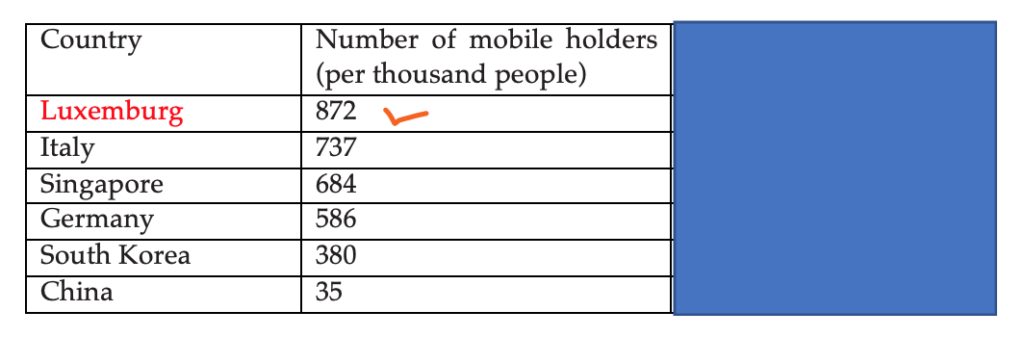
Step 1: Find out the highest/maximum for both mobile holders and PC owners individually.
In mobile phones – Luxemburg
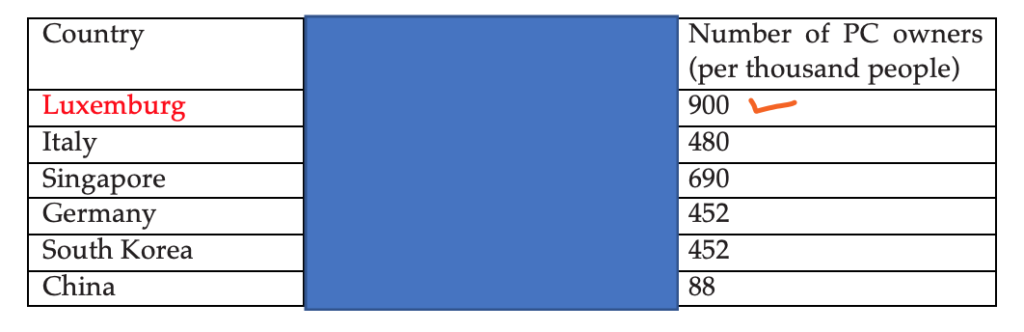
In PCs – Luxemburg
Step 2: Express it, Note: If the country was not the same, use comparison.
Overall, it is clear that Luxemburg had the highest mobile phone as well as PC ownershs. (Sentence 2)
Sentence 3 (Sentence 2 of overall):
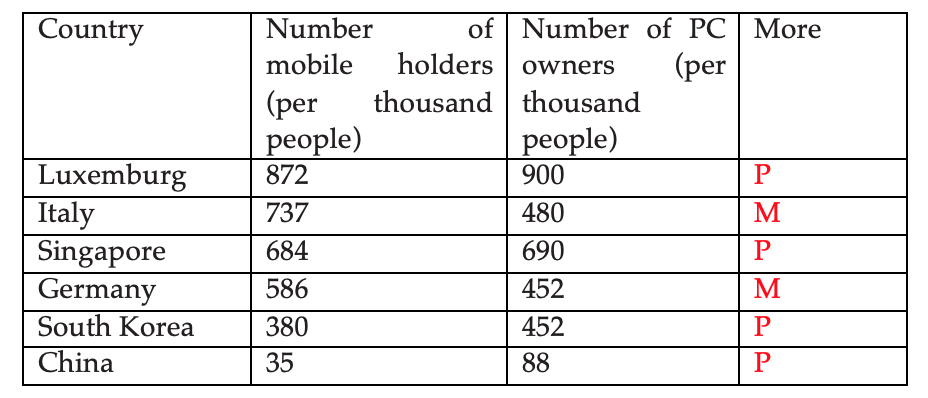
Step 1: Compare mobile phone ownership and PC ownership in each country individually.
Where PC ownership more, mark P
Where Mobile ownership more, mark M
If equal – mark S
Step 2: Express, this in one sentence
In all the countries apart from Italy and Germany, PC owners outnumbered mobile phone ownership. (Sentence 3)
Introduction + Overview:
The table graph illustrates the number of people per thousand who possessed mobile phones and personal computers in six countries in 2003.
Overall, it is clear that Luxemburg had the highest mobile phone as well as PC ownership. In all the countries apart from Italy and Germany, PC owners outnumbered mobile phone ownership.
Length – 53 words.
Writing the Body Paragraphs
Step1: Again, mark what is more, like we did in the introduction.
Step 2: Divide the information in two body paragraphs accordingly.
Body Paragraph 1: Where P is more – Luxemburg, Singapore, South Korea, and China
Body Paragraph 2: Where M is more – Italy and Germany
Body Paragraph 1 (Sentences 4 to 6):
Step 1: Data for Luxemburg.
Mention in such a way that it clarifies that P > M – Sentence 4
Step 2: Data for Singapore and South Korea – Sentence 5.
Step 3: Data for China – Sentence 6.
Note: Please pay attention to all the comparison words used and their usage. ( Marked in green)
In detail, it can be seen that around 900 people per thousand owned personal computers in Luxemburg and the comparative figure for mobile owners was marginally less at 872 per 1000 people. Similarly, in Singapore and South Korea, PC ownership stood at 690 and 452 per 1000 people respectively, while the figures for mobile phone users were 684 and 380 respectively. China had the least figures with just 35 people owning mobile phones per 1000 people and 88 people possessing a PC per 1000 people. (Sentence 4,5,6)
Body Paragraph 2 (Sentences 7 to 9):
Write for the countries where M>P
Sentence 7: Mention the countries with M >P, bring in a comparison with the previous paragraph.
Sentence 8: Data for Italy
Sentence 9: Data for Germany.
Unlike the above-mentioned countries, in Italy and Germany, more people owned mobile phones than personal computers. In Italy, 737 per 1000 people owned mobile phones, while the figure for PC owners was about 250 less. In Germany, PC ownership was the same as in South Korea at 452 per 1000 people, but about 580 per 1000 people had mobile phones. (Sentence 7,8,9)
The whole graph
The table graph illustrates the number of people per thousand who possessed mobile phones and personal computers in six countries in 2003.
Overall, it is clear that Luxemburg had the highest mobile phone as well as PC ownership. In all the countries apart from Italy and Germany, PC owners outnumbered mobile phone ownership.
In detail, it can be seen that around 900 people per thousand owned personal computers in Luxemburg and the comparative figure for PC owners was marginally less at 872 per 1000 people. Similarly, in Singapore and South Korea, PC ownership stood at 690 and 452 per 1000 people respectively, while the figures for mobile phone users were 684 and 380 respectively. China had the least figures with just 35 people owning mobile phones per 1000 people and 88 people possessing a PC per 1000 people.
Unlike the above-mentioned countries, in Italy and Germany, more people owned mobile phones than personal computers. In Italy, 737 per 1000 people owned mobile phones, while the figure for PC owners was about 250 less. In Germany, PC ownership was the same as in South Korea at 452 per 1000 people, but about 580 per 1000 people had mobile phones.
Check out more examples of Table here
More Graph Types